Running the Bicycle Network Priority Tool on Redwood City - Initial Findings
Guest Blog by Lisa Rayle (Volunteer and active member of San Mateo local team). Lisa is running the Bicycle Network Priority Tool on the city of Redwood City. Below are her initial findings.
Summary
SVBC ran an initial analysis to prioritize streets of Redwood City for bike facility improvements, as input to the city’s active transportation planning process.
The area east of downtown has the greatest need for better bike infrastructure. This is because this area:
is currently not well served by the bike network;
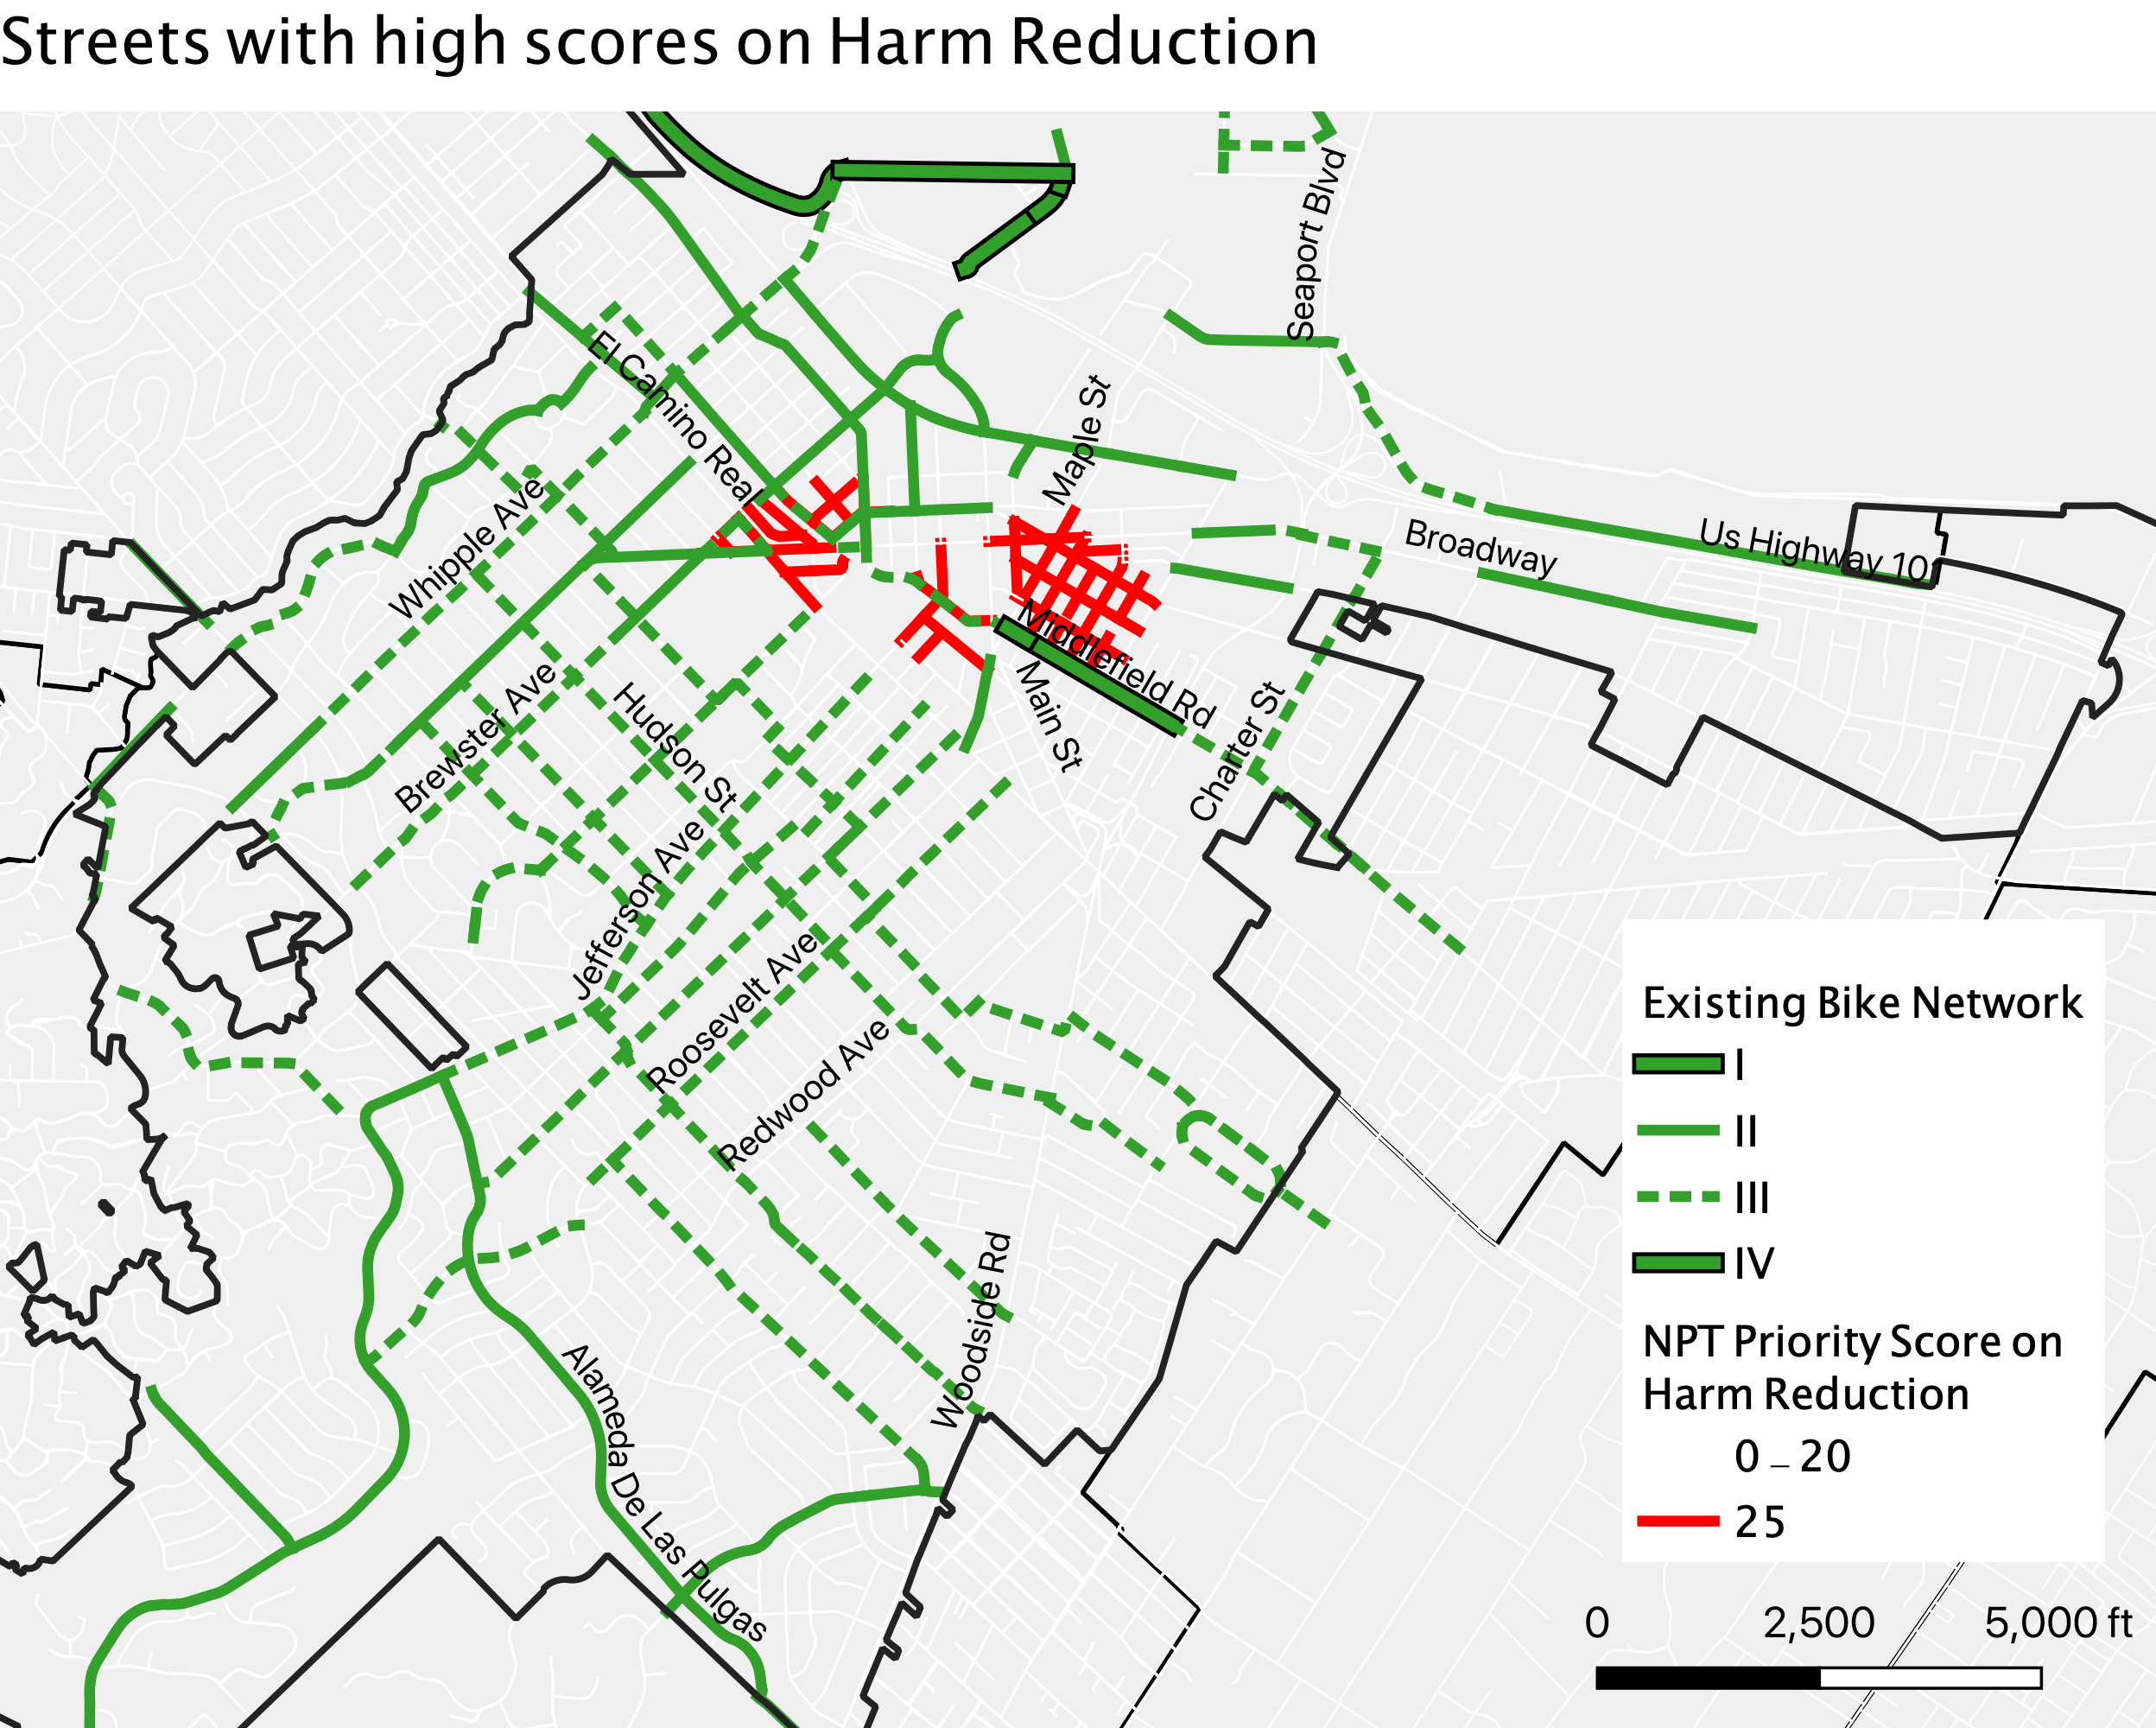
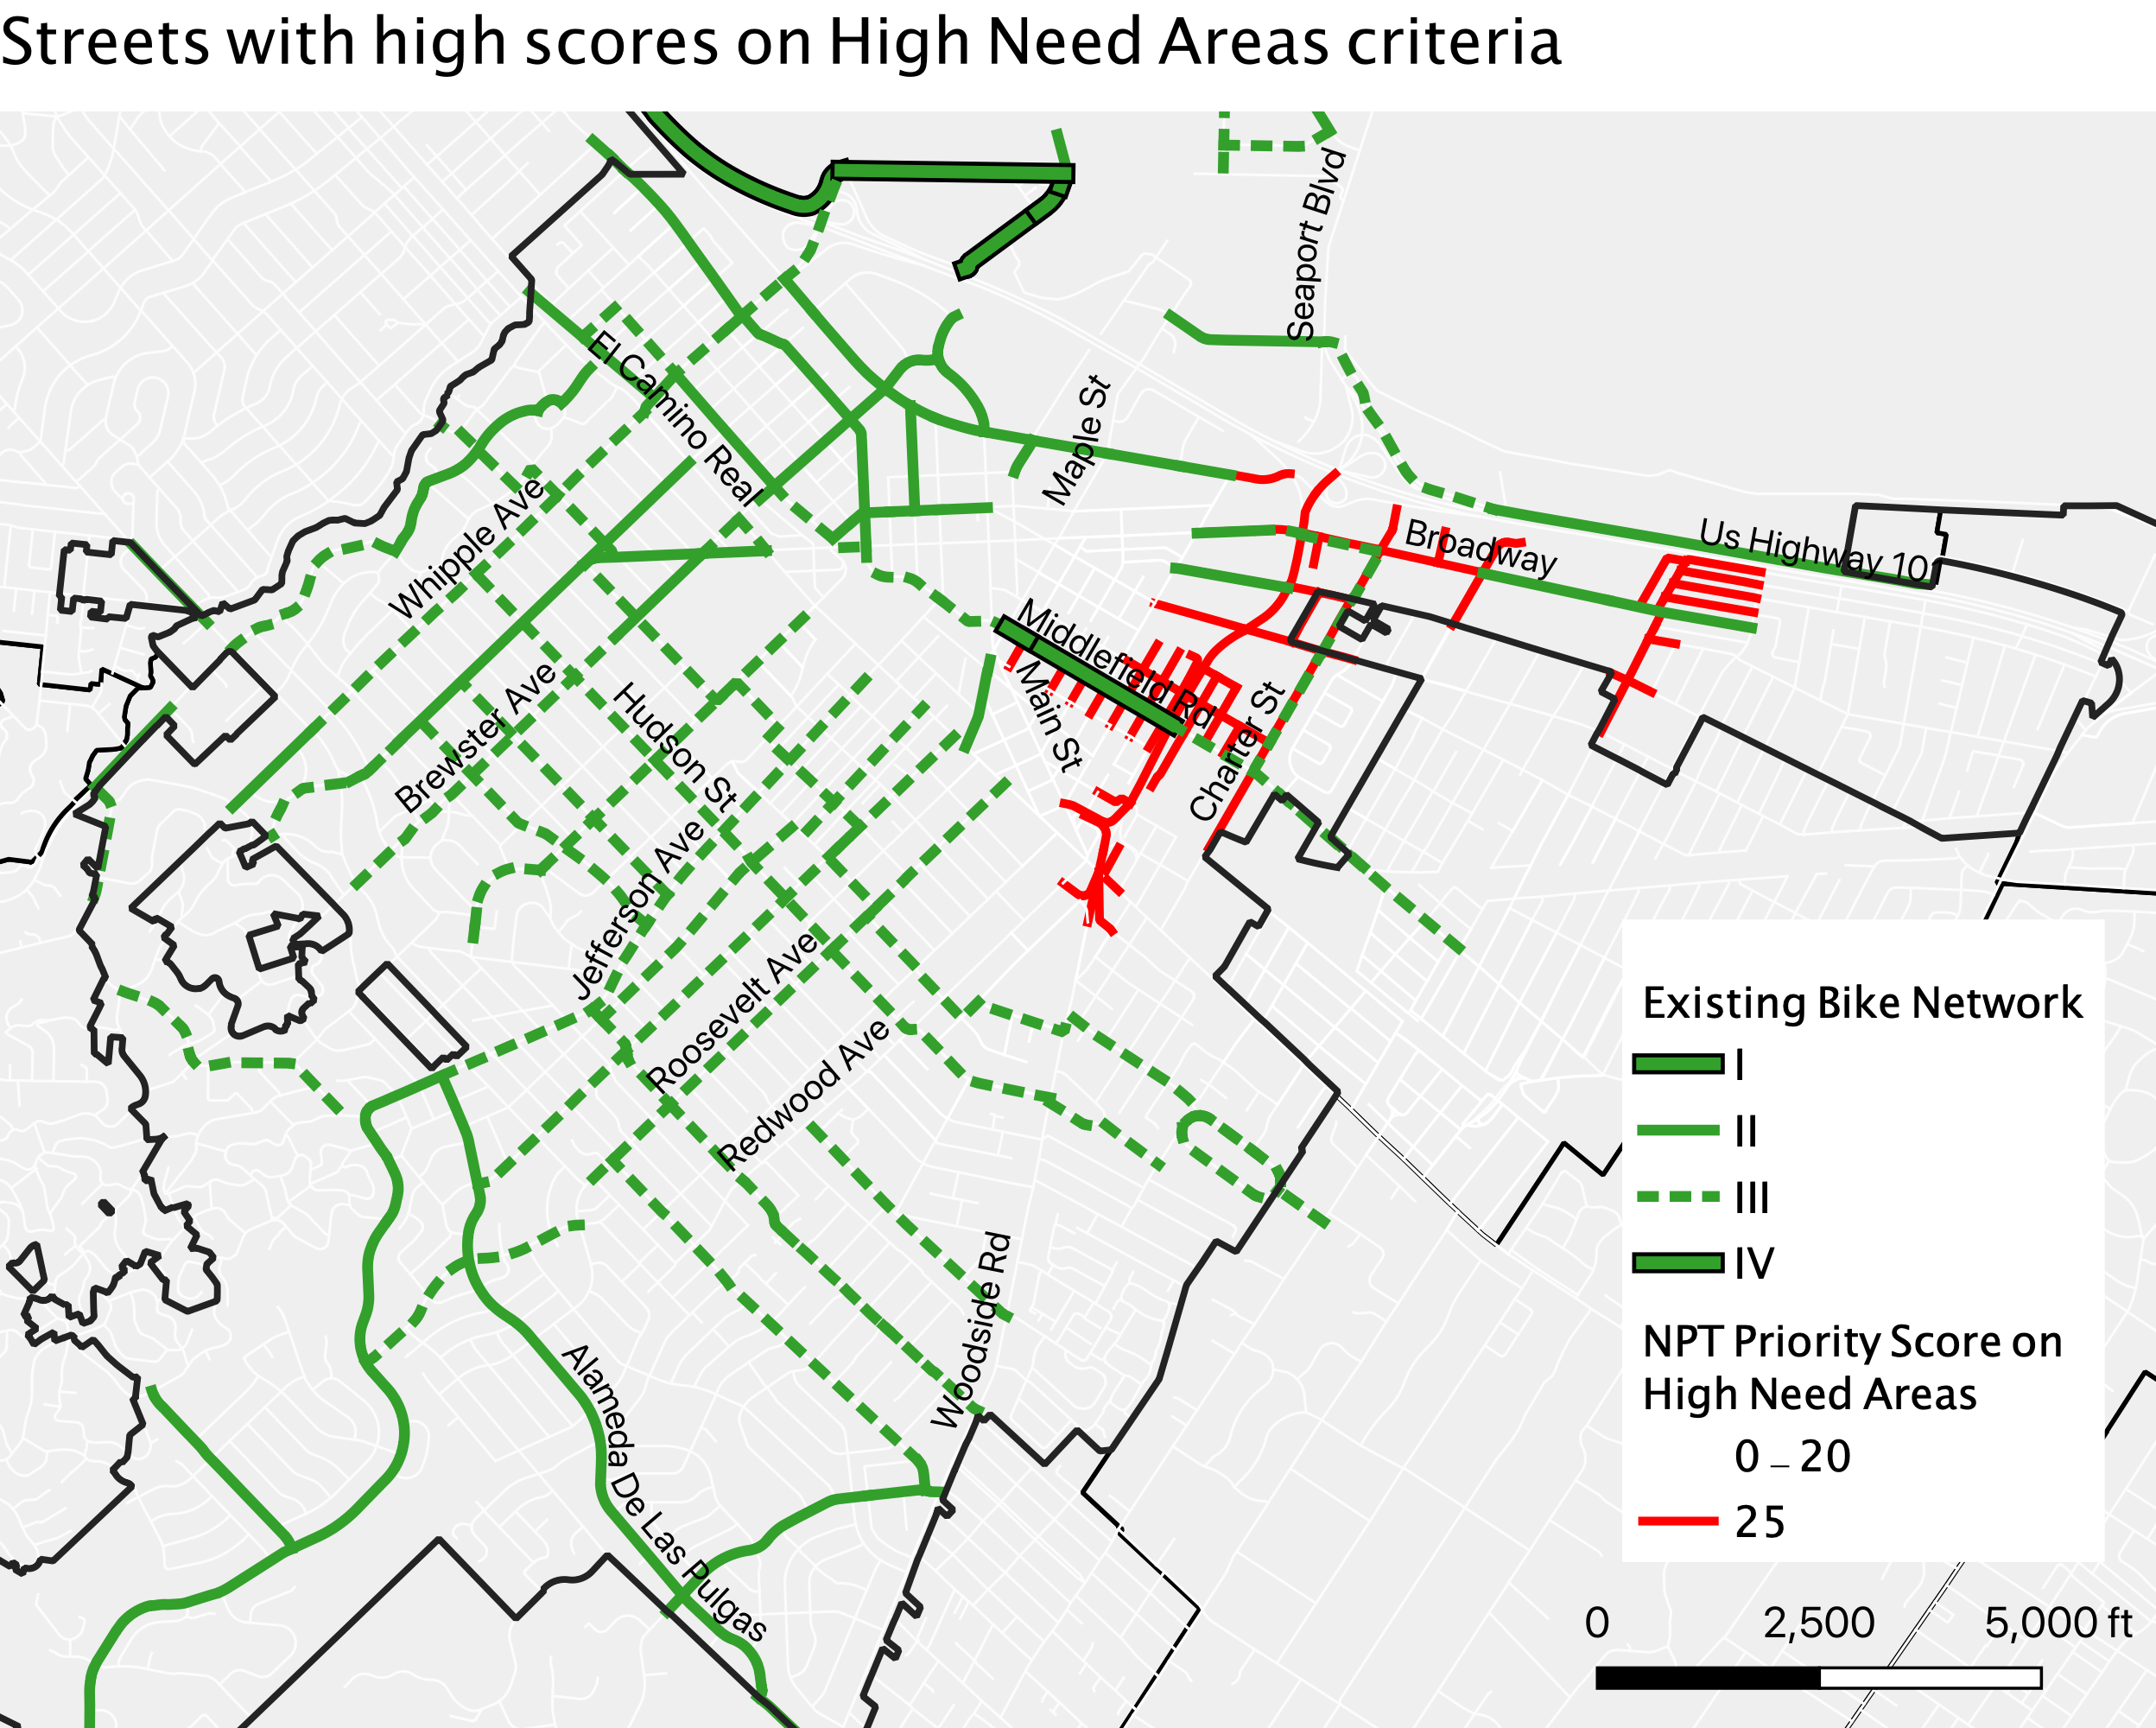
scores highly on High Need Area criteria, which include income level, Communities Of Concern, auto access, and population density metrics;
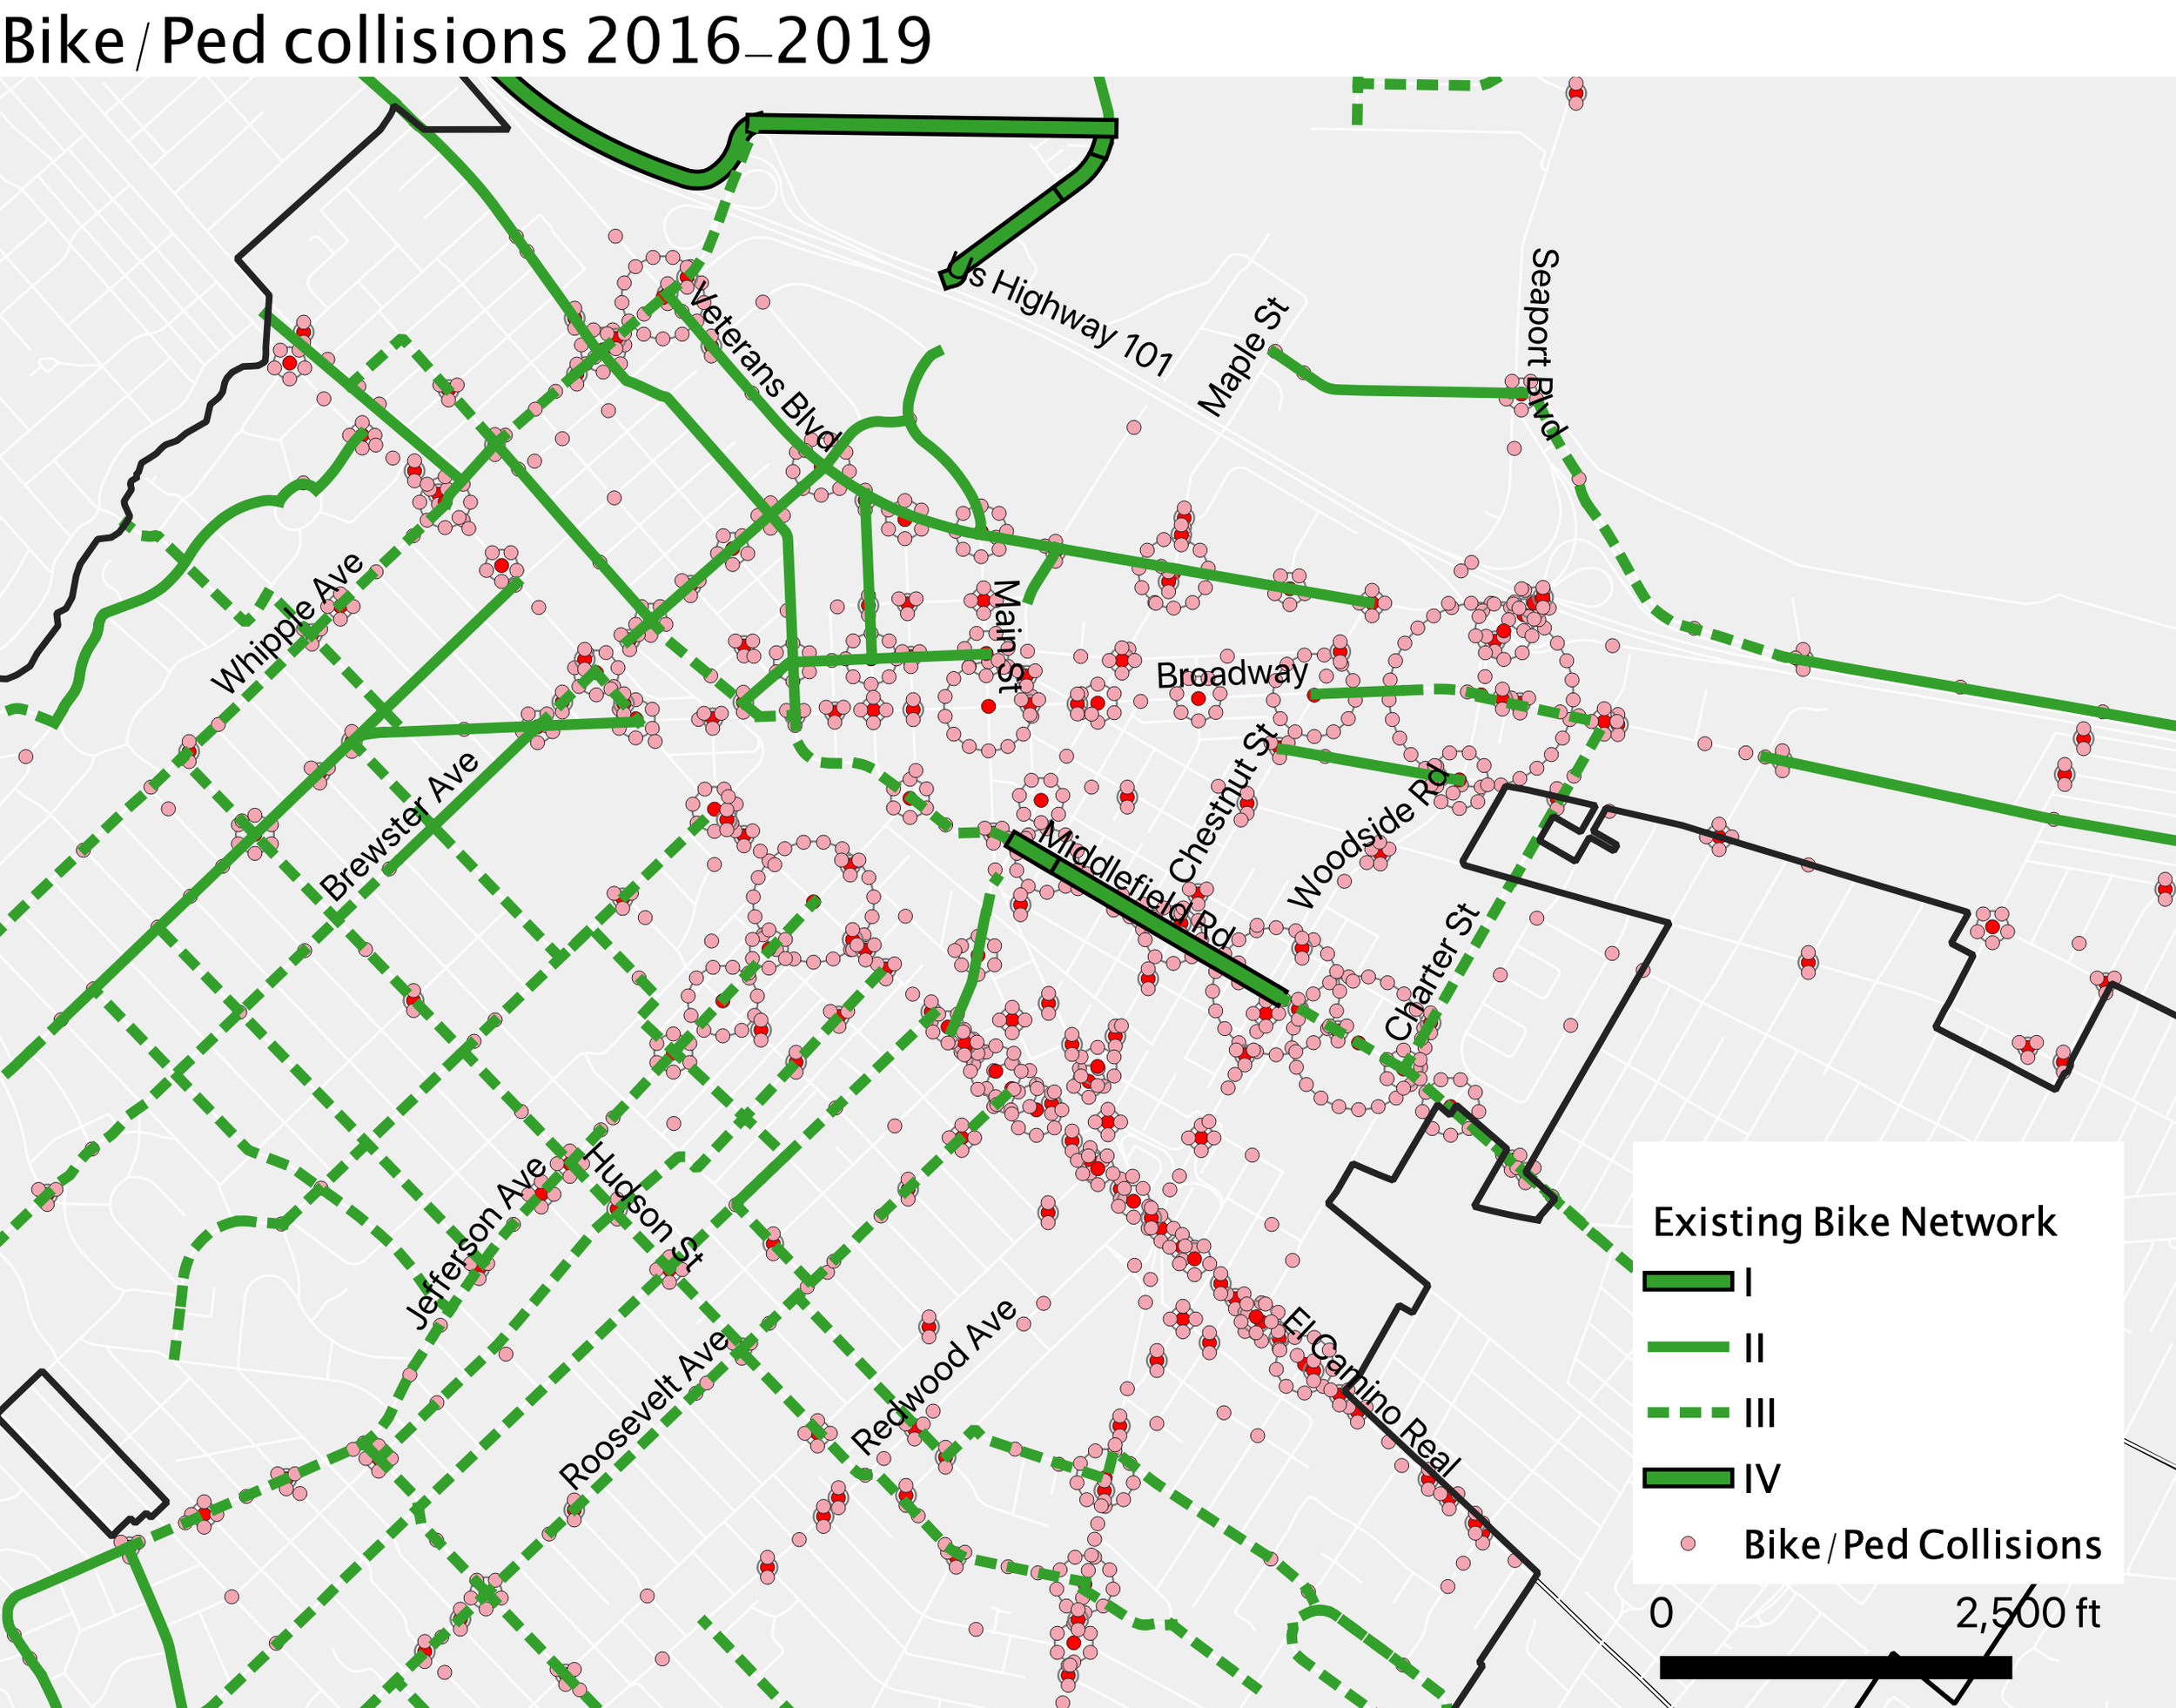
has a high rate of collisions and fatalities.
The high-volume roads crossing this area, like Broadway and Woodside, may make the creation of low-stress bike connections difficult, but that is more reason to prioritize high-quality facilities here.
Context
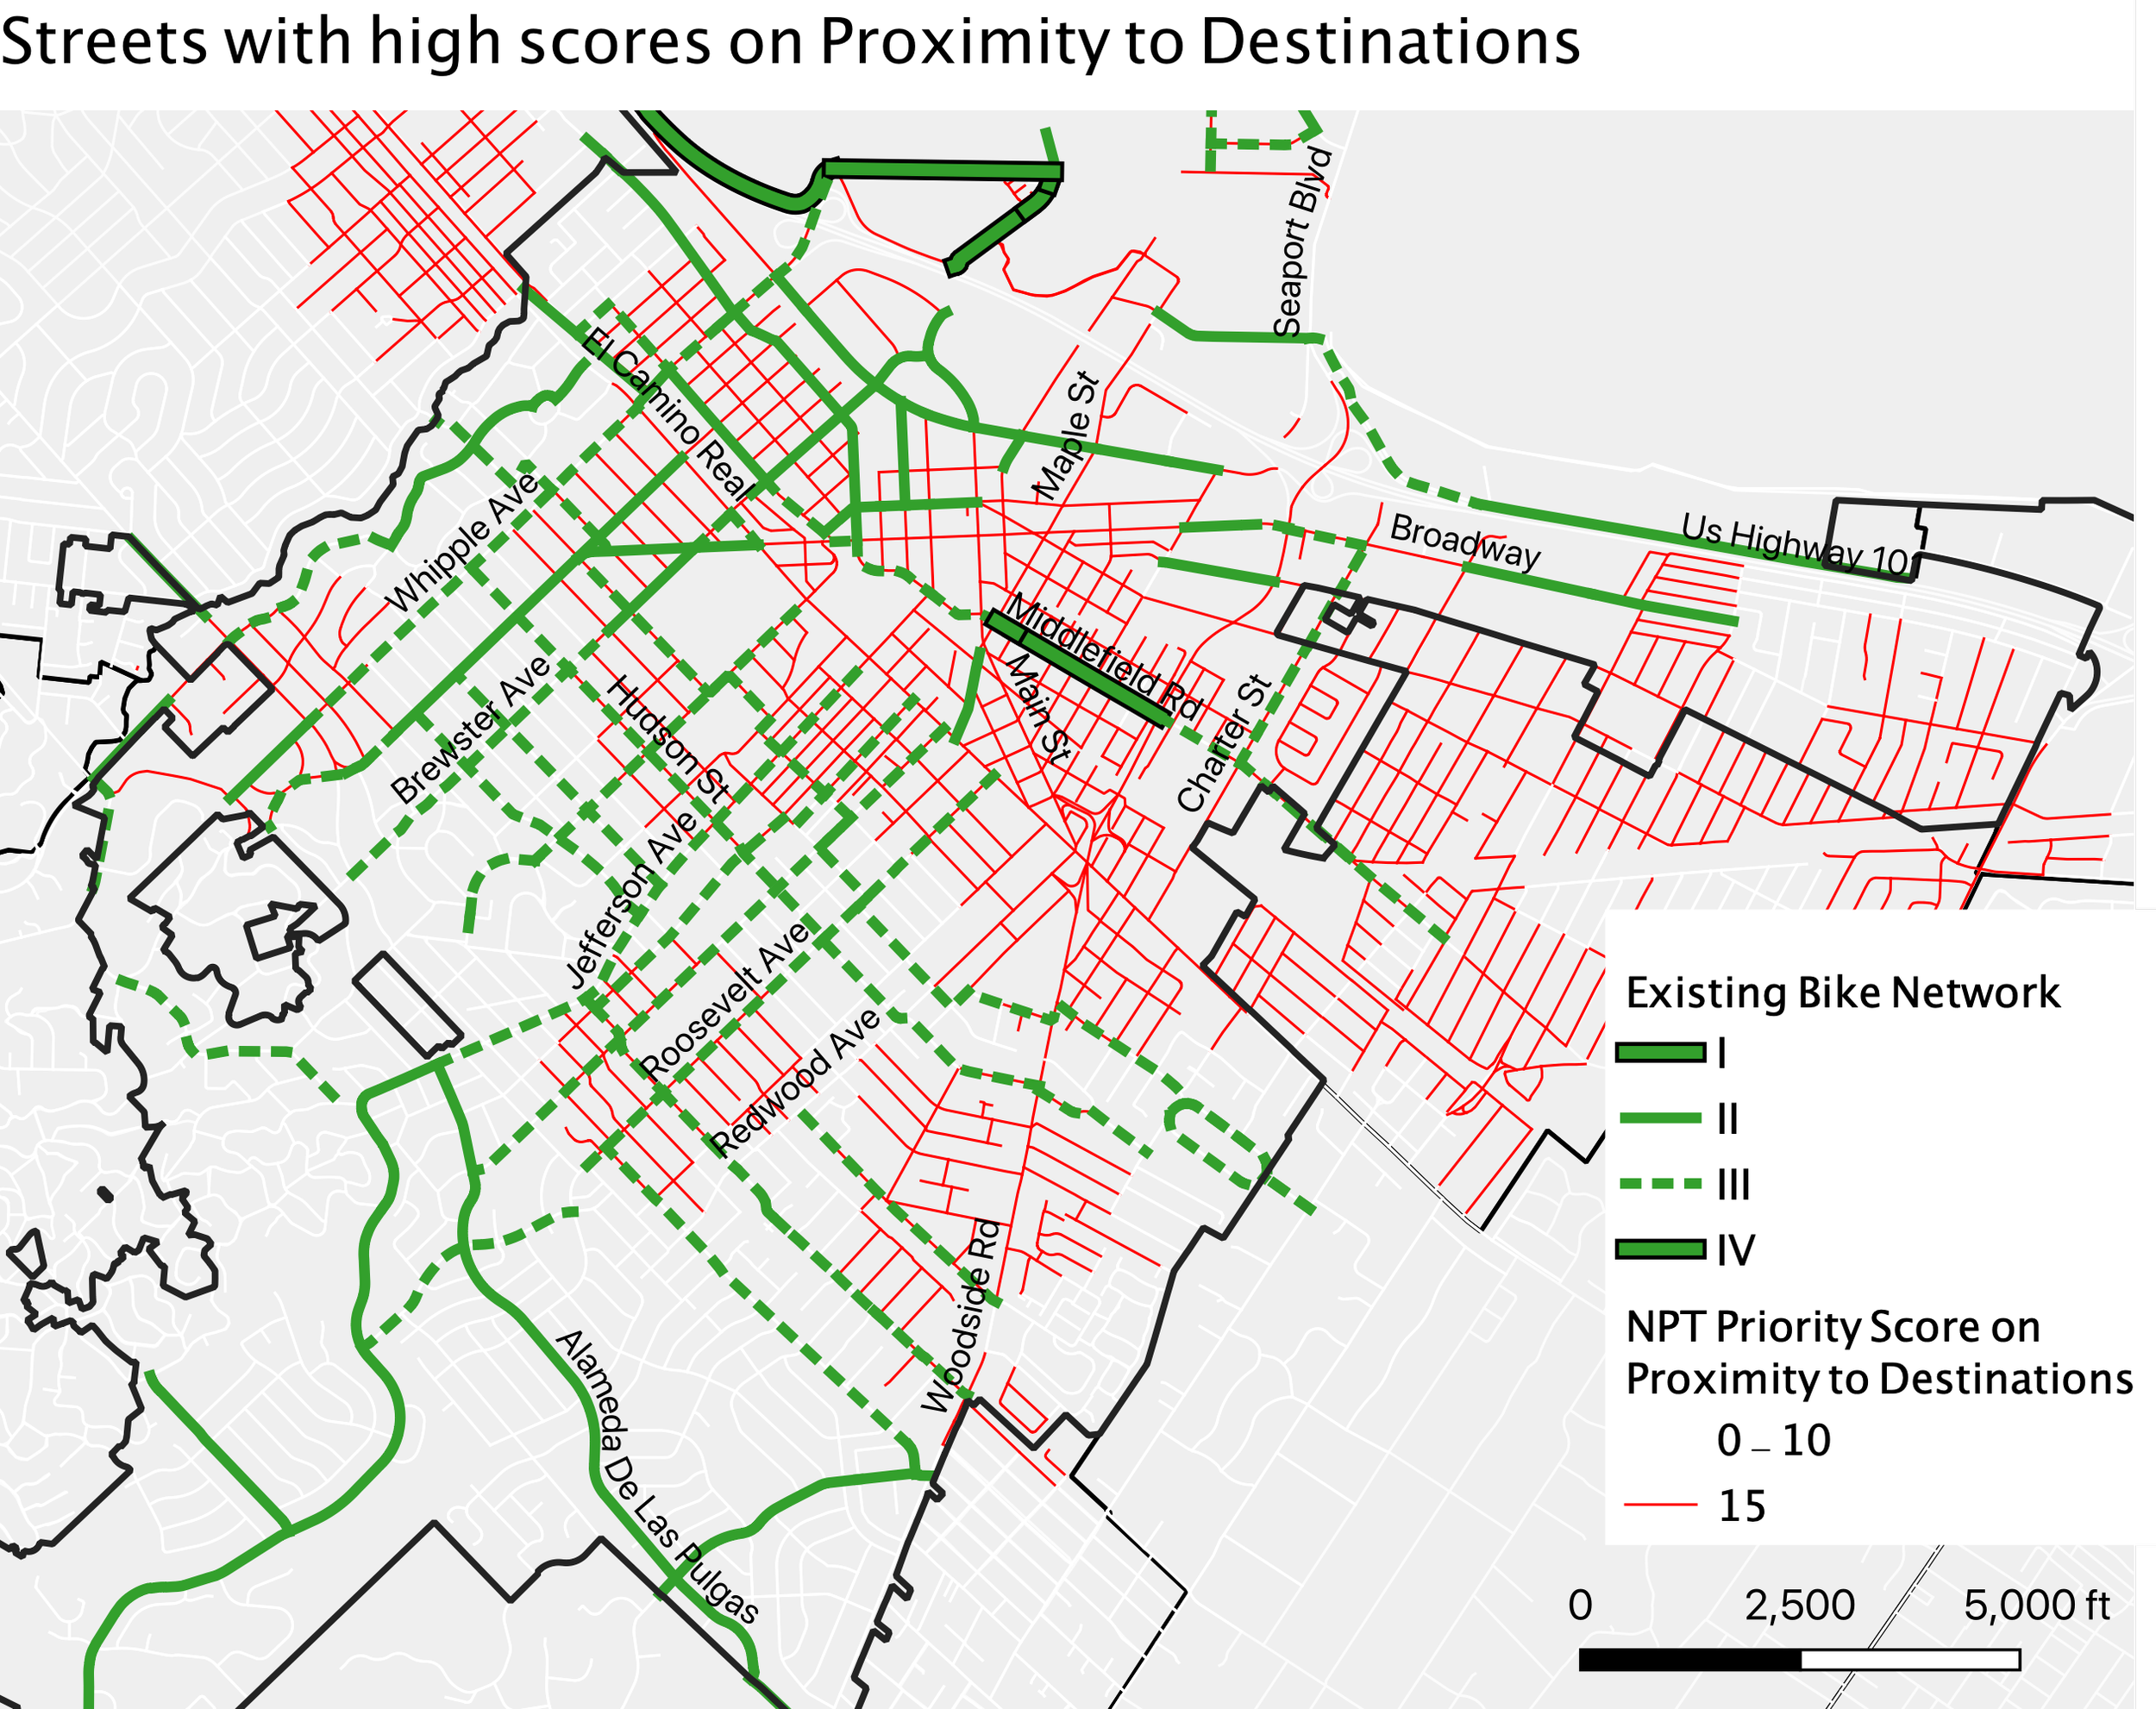
As part of Redwood City’s Walk Bike Thrive initiative–a project to make walking and biking safer, easier, and more popular–SVBC is providing input based on the bicycle Network Priority Tool (NPT). The purpose of the NPT is to help planners and advocates to prioritize bicycle projects in order to create a low-stress bike network. The tool assigns each street segment or project an overall priority score using 17 criteria that measure need, proximity to destinations, harm reduction, and network connectivity.
This blog post highlights initial findings from running the NPT on Redwood City streets. These preliminary results are intended to generate discussion in the planning process. Full results will follow once Redwood City has identified proposed bicycle projects.
Key initial findings
The area east of downtown has the greatest need for bike infrastructure improvements.
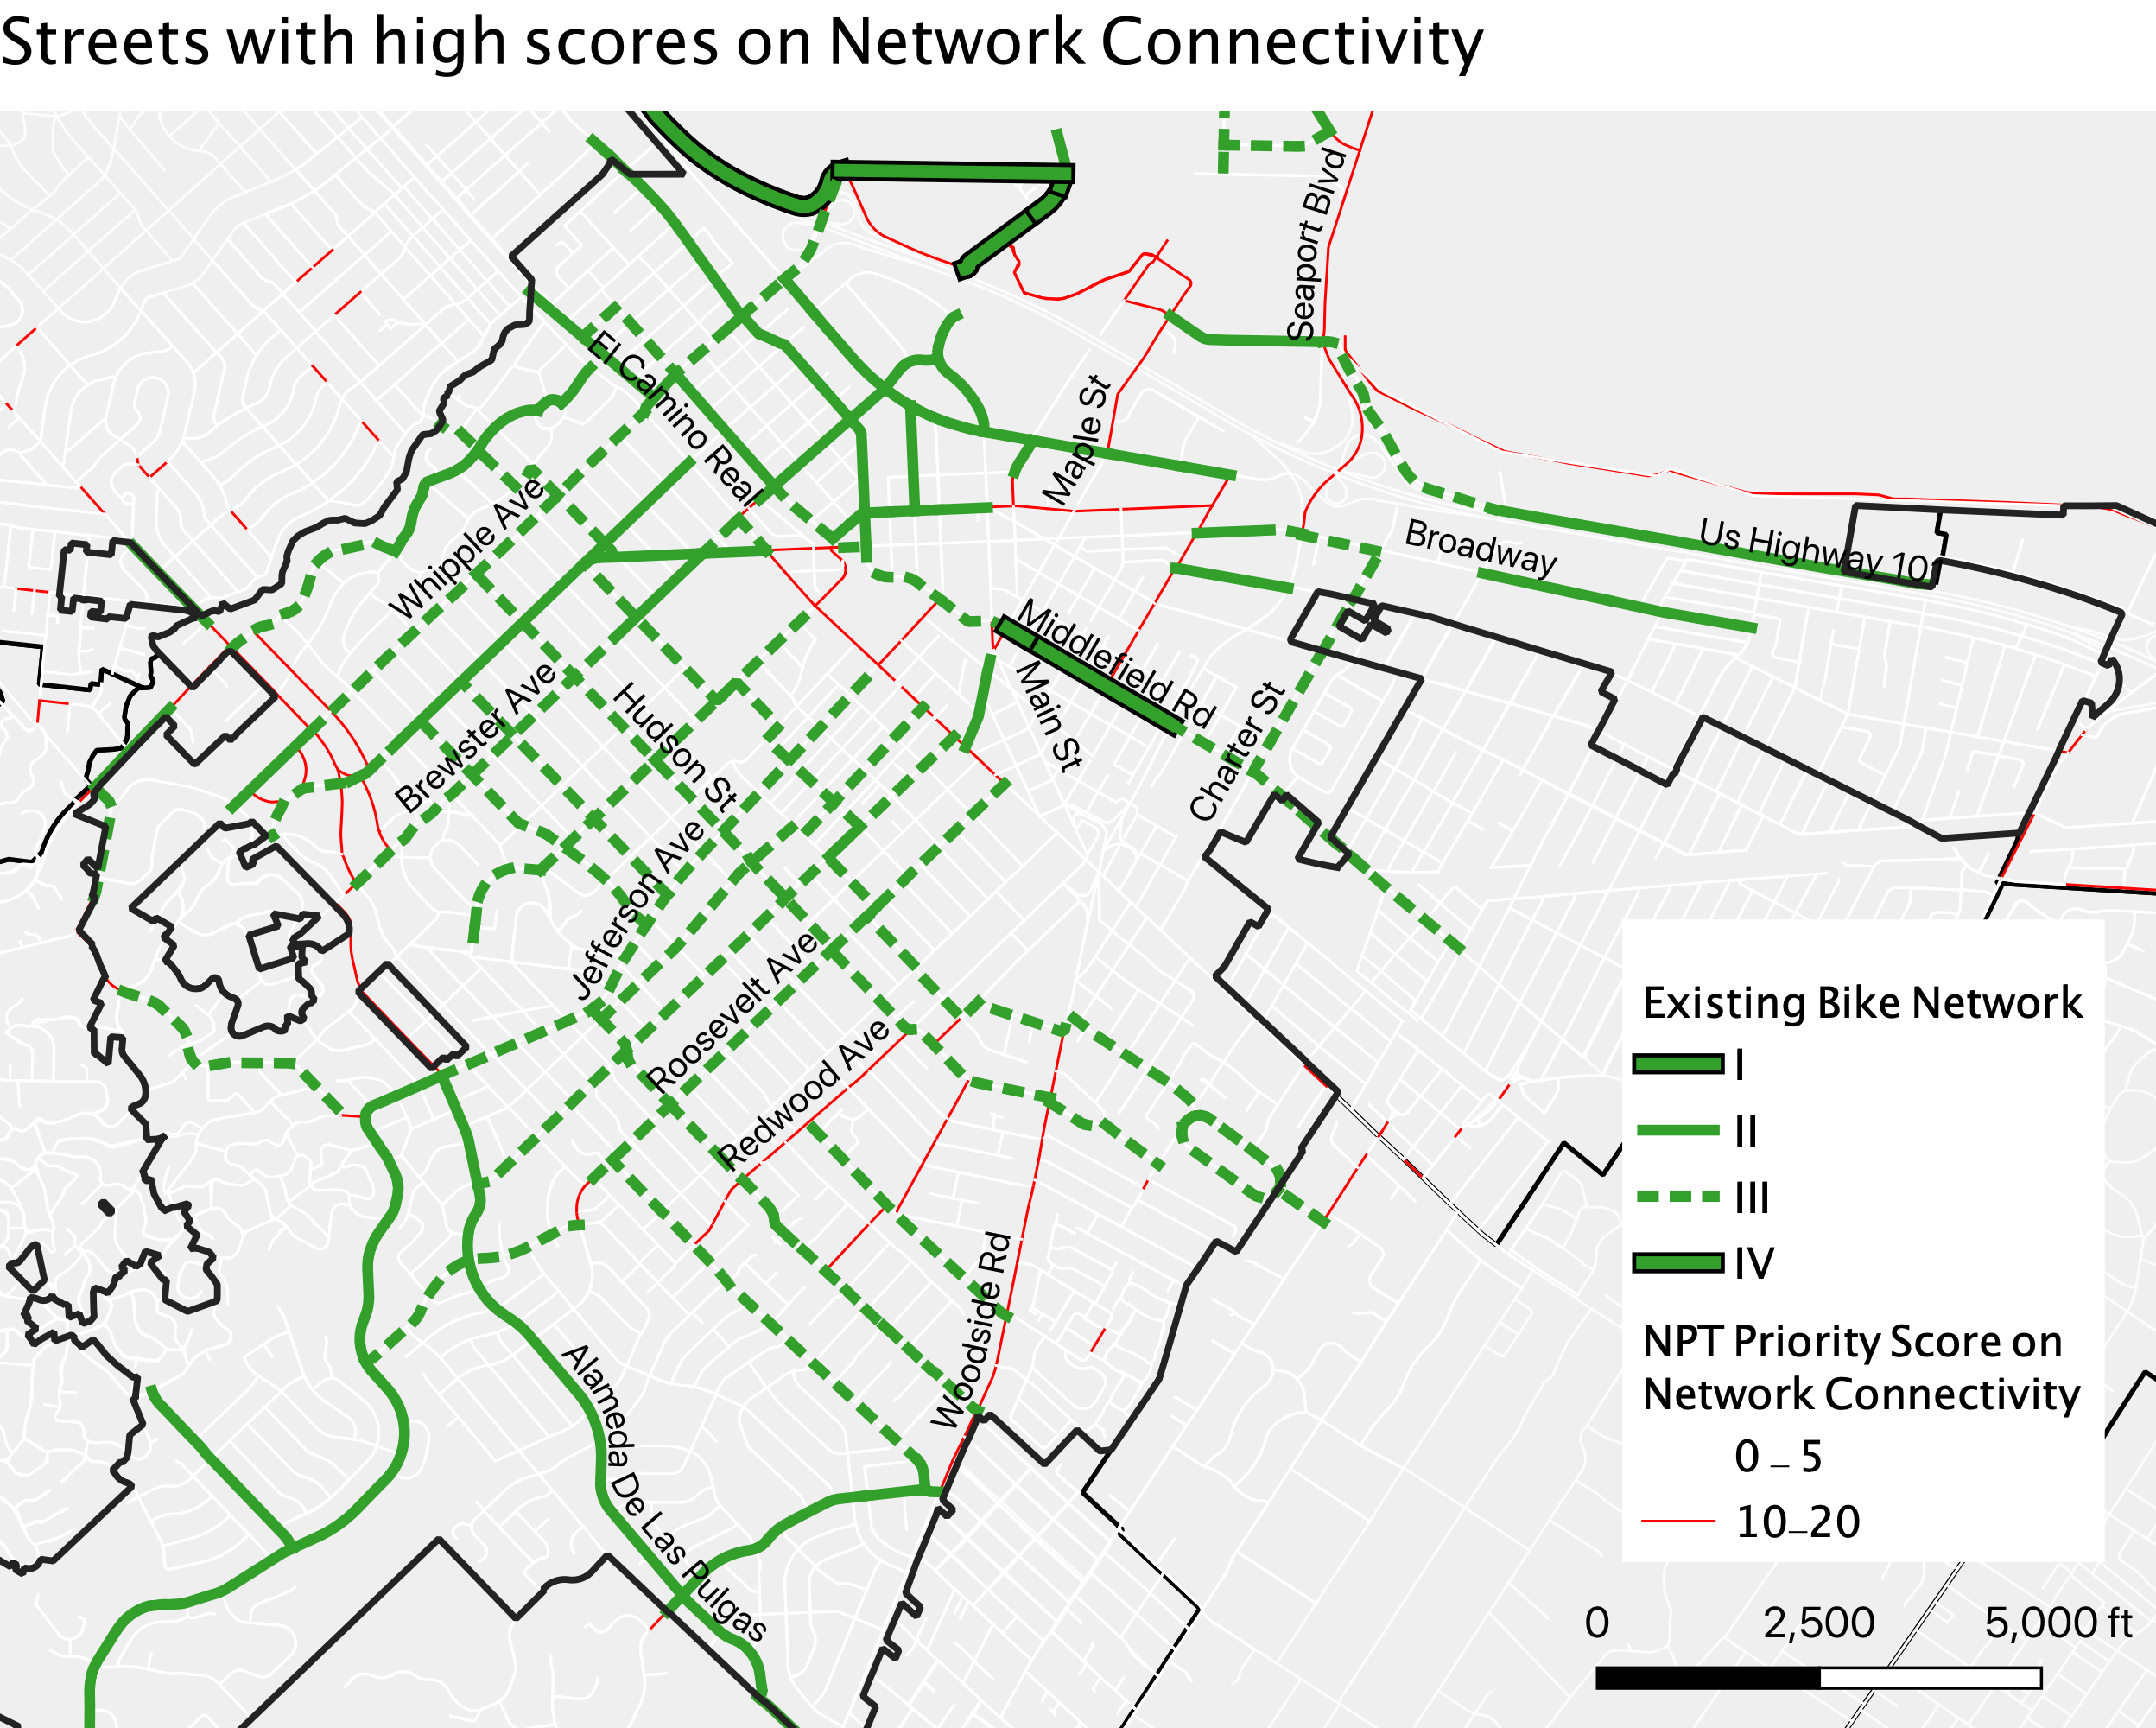
As shown in the map below, the streets in red and orange have high prioritization scores, indicating they would benefit most from better bike facilities. As we will see, these high scores are driven heavily by criteria in the High Need Areas and Harm Reduction categories. In other words, these areas have a high need for bike transport–based on metrics like population density, income levels, car ownership, and non-English speaking households–and would benefit from safety improvements–based on crash rates and proximity to schools and senior centers. (The high priority areas also have high scores for Proximity to Destinations and Network Connectivity, but red and orange streets are set apart by their High Need Area and Harm Reduction scores.)
When we overlay existing bike routes, in green on the map below, we can see that the network doesn’t serve areas of greatest need particularly well. That might be partly because this area’s irregular street grid and need to cross Woodside Rd make building low-stress bike facilities relatively difficult. However, this is also an important opportunity: high-quality bike projects here would not only fill gaps in the existing network, but would also serve high need populations and improve safety.
Limitations and next steps
This is an initial analysis that did not consider the different classes of existing bike facilities, nor connections to neighboring cities’ bike networks. Those will be considered in the final analysis and might bring in some interesting dynamics in street rankings.
This analysis is on short street segments rather than longer corridors. That means it identifies specific streets that would benefit from bike facilities; it does not mean we recommend building a bikeway on every single street highlighted in red or orange. In the next step, we will run it on proposed corridors and the output of that analysis will be a prioritization score for each corridor.
Importantly, this analysis does not consider the feasibility of building bike facilities. While of course feasibility is important for any bike plan, this analysis shows the great level of need for bike facilities in an area of the city where building bike infrastructure is relatively difficult.
Takeaways
Prioritizing the highlighted areas for bike infrastructure would not only improve connectivity of the existing network, it would also serve high need populations and improve safety.
In next steps, we will run the prioritization on proposed bike corridors, for the city to use as input in its final plan.
Deep dive
The SVBC methodology uses 17 weighted criteria grouped into four categories. Let’s dive into each of the NPT’s four criteria groups.